Research
Terrestrial Radar Interferometry
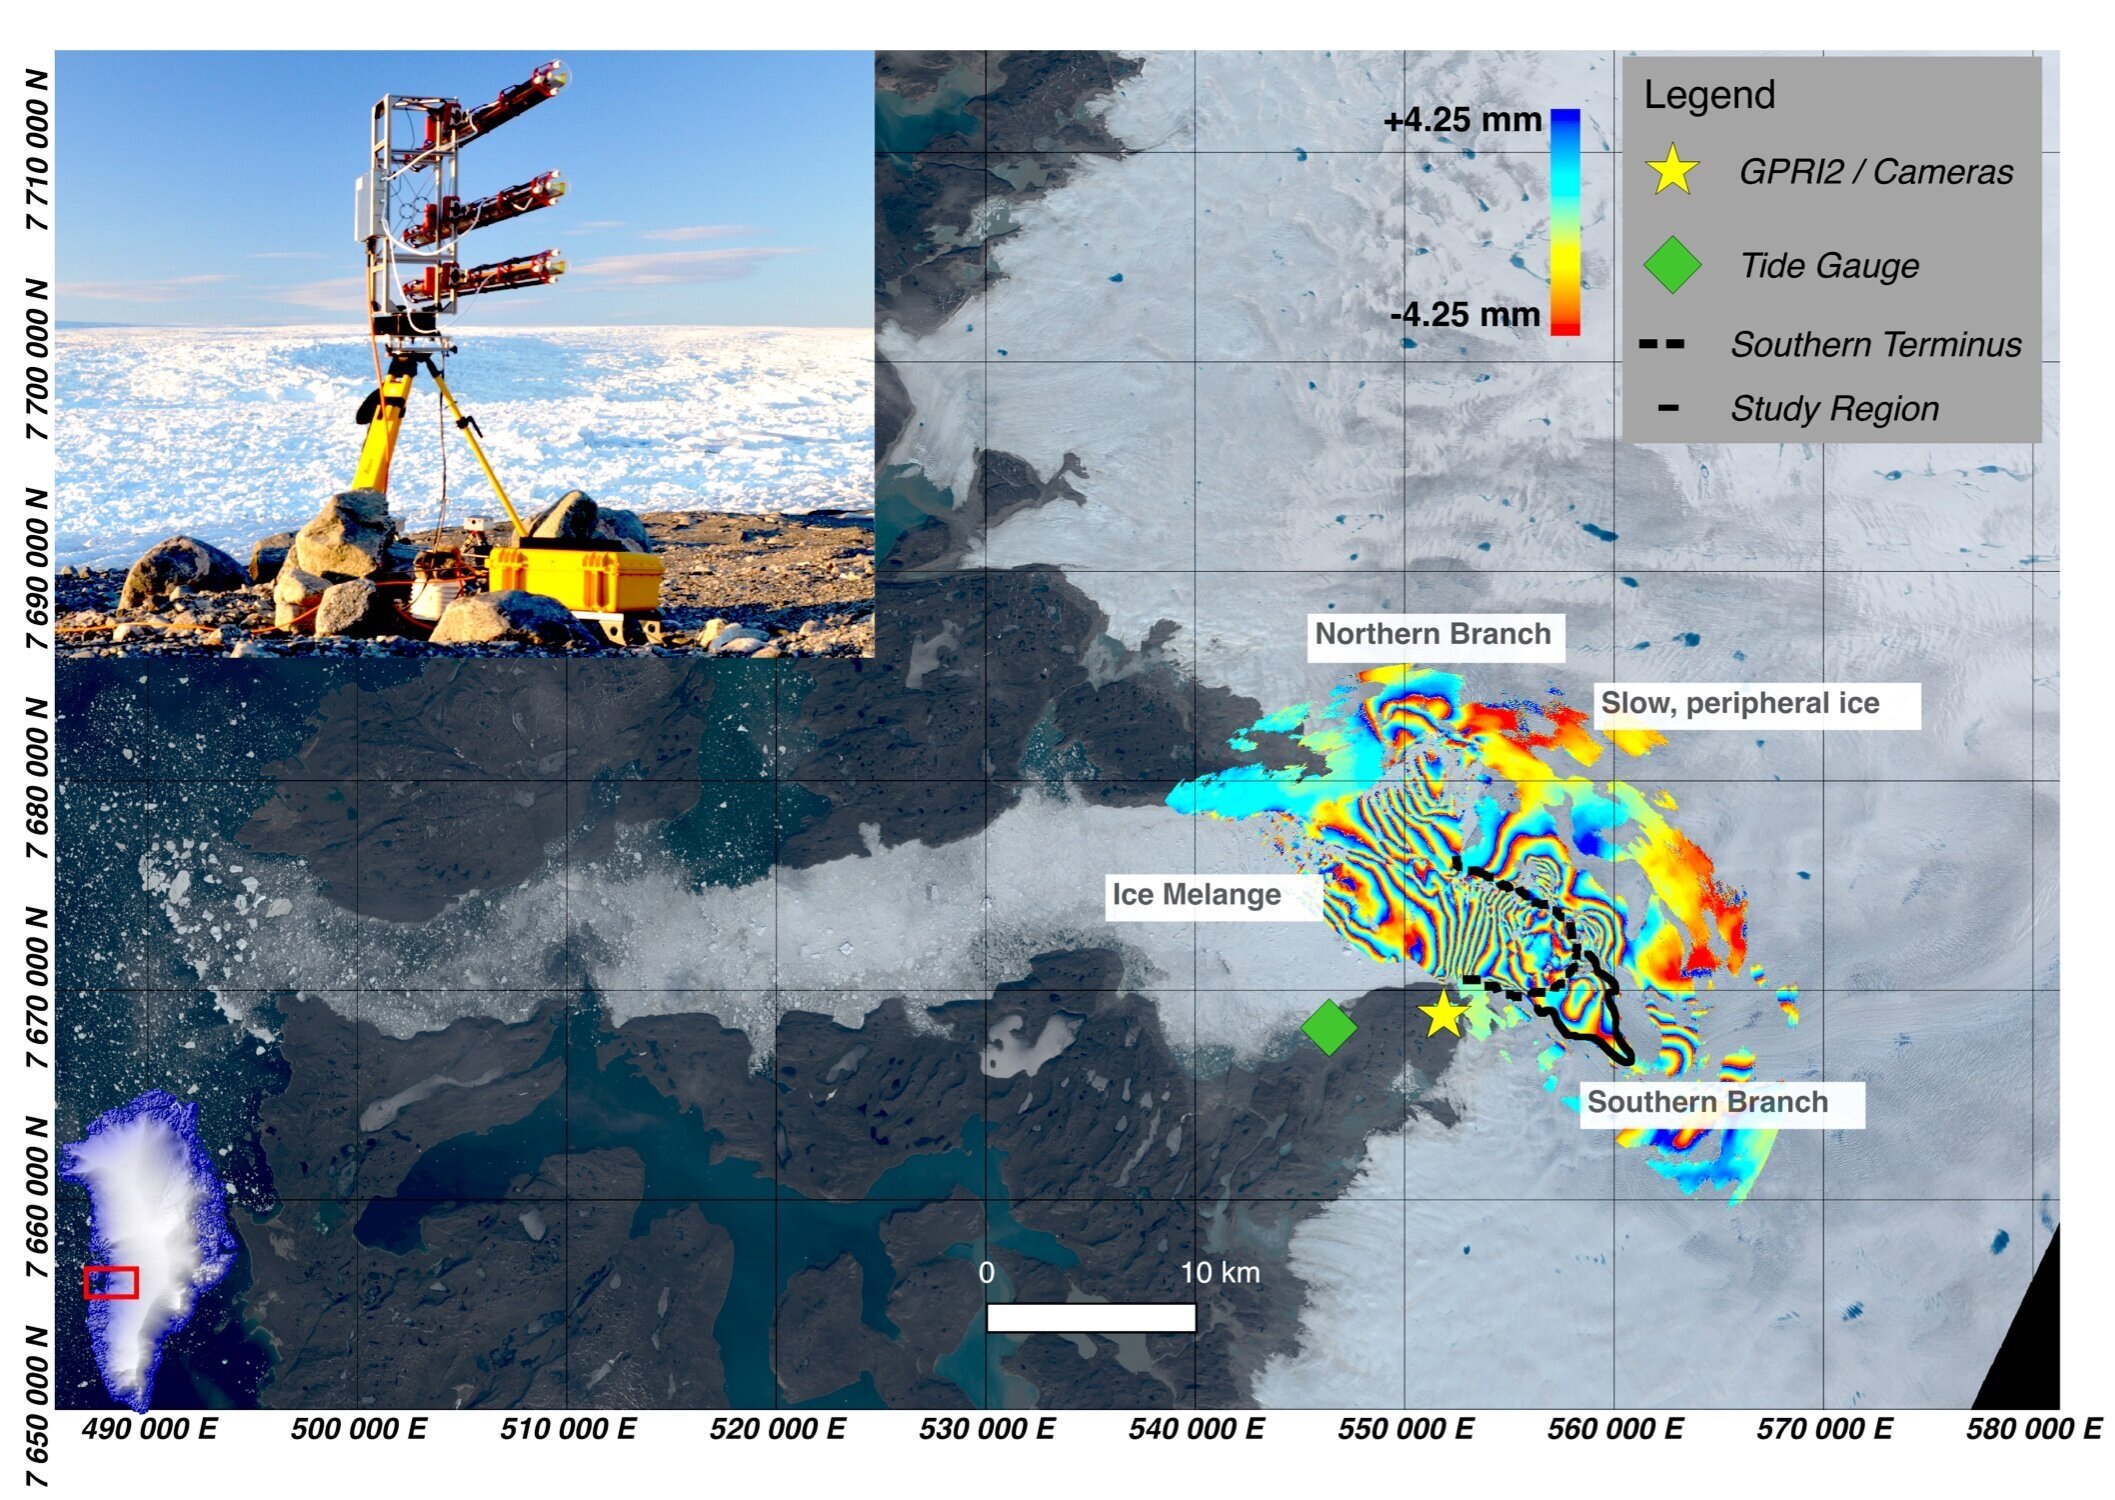
Terrestrial radar interferometry is a major component of my research. These radars generate images of the radar’s returned signal called backscatter (top right) and interferometric maps (bottom right) - the latter represents deformation changes measured over the fraction of the radar’s wavelength, here 1.75 cm. Speckle or feature tracking can be applied to the backscatter to generate flow velocities. Interferometric measurements are used to measure surface elevations or line-of-sight speeds. I have applied these TRIs to measure changes along fast-moving tidewater glaciers (10’s meters per day), earth flows (cm’s per day), and aseismic slip along an earthen dam (mm’s per year).
SAR-derived Wildfire Monitoring
Wildfires pose an existential threat to our health, safety and infrastructure. Modern climate change further exacerbate wildfire impacts, elevating the risk due to these natural hazards. Thus, monitoring wildfire evolution in near-real-time is critical for strategizing wildfire response and assessing post-fire damage. Modern burn area mapping techniques use thermal infrared remote sensing observations to calculate a proxy known as the normalized burn ratio. While valuable, the spectral data used for this derivation suffer from cloud and smoke effects, which introduces measurement noise and limits observational capabilities.
In contrast, Synthetic Aperture Radar or SAR can penetrate through clouds and smoke to provide continuous observations of earth’s surface. SAR observations present a new opportunity to monitor wildfire activity using much higher sampling rates, providing a more effective tool for wildfire monitoring. One of my current projects is dedicated to developing algorithms to monitor wildfire evolution in near real time using SAR coherence and SAR polarimetry. SAR coherence (left) is a metric used to evaluate changes in the geophysical surface between two SAR acquisitions.
SAR polarimetry (right) uses data acquired from multiple antenna configurations to evaluate surface change. These polarimetric observations are then reduced to a luminance value that incorporates polarimetric differences into a single value that are used to assess burn areas. As shown, the positive change in luminance indicates new vegetation burned between Aug 8 and 20, 2020.


